Foreign nationalities compose nearly half of Luxembourg’s resident population (~47.17% as of 01.01.2021). The top 10 nationalities as a percentage of total population, together represents nearly 9 out of every 10 residents, are as follows:
| Sl. No. | Nationality | Percentage |
|---|---|---|
| 1. | Luxembourg 🇱🇺 | 52.83 % |
| 2. | Portugal 🇵🇹 | 14.86 % |
| 3. | France 🇫🇷 | 7.64 % |
| 4. | Italy 🇮🇹 | 3.71 % |
| 5. | Belgium 🇧🇪 | 3.09 % |
| 6. | Germany 🇩🇪 | 2.01 % |
| 7. | Spain 🇪🇸 | 1.21 % |
| 8. | Romania 🇷🇴 | 0.96% |
| 9. | Poland 🇵🇱 | 0.78 % |
| 10. | United Kingdom 🇬🇧 | 0.72% |
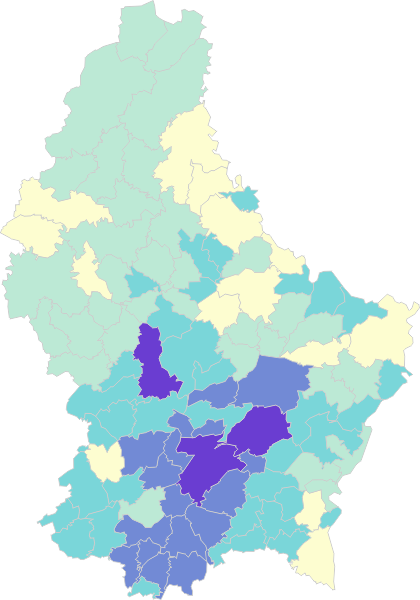
Below is a snapshot of over 175 nationalities of the Luxembourg resident population as of 31.03.2021. Nationalities with n<1,000 are shown as ‘similar sized circles’ for ‘better visualization and clickability purposes’.
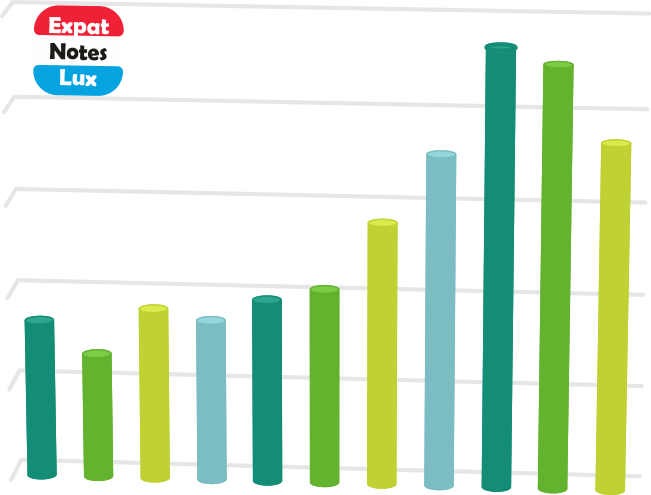
Below is the evolution of ‘foreign’ nationalities as Luxembourg resident population since 1990.
data source: STATEC